Your cart is currently empty!
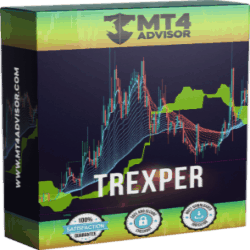
TREXPER INDICATOR
TREXPER INDICATOR www.mt4advisor.com/collections/products/products/trexper-indicator Content: Trexper.ex4, Trexper Manual.pdf, Installation Guide.pdf Trexper indicator uses the calculation of the same infamous indicator named “Donchian channel” -an indicator used in market trading developed by Richard Donchian. It is formed by taking the highest high and the lowest low of the last n periods. The area between the high and the low is the channel […]
Description
TREXPER INDICATOR
www.mt4advisor.com/collections/products/products/trexper-indicator
Content: Trexper.ex4, Trexper Manual.pdf, Installation Guide.pdf
Trexper indicator uses the calculation of the same infamous indicator named “Donchian channel” -an indicator used in market trading developed by Richard Donchian. It is formed by taking the highest high and the lowest low of the last n periods. The area between the high and the low is the channel for the period chosen in conjunction with another powerful indicator named “Moving Average Ribbon”, which is a series of moving averages of different lengths plotted at the same time on a chart.
In our case our indicator uses 18 different lengths of moving averages for the moving average ribbon and it is calculated based on the simple moving average (SMA) or Exponential moving average (EMA). The Donchian channel and the ribbon indicate the market trend direction. When the current price is above the channel or ribbon it should clearly indicate a bullish trend or buyers getting optimistic and the bulls dominating against bears and when the price is lower the channel or ribbon it should indicate a bearish trend or sellers/bears dominating against bulls.
This ribbon and channel both acts also as dynamic resistance and support depending on where the current price is floating. Price floating above the channel and ribbon will act as a support level and when price floating below the channel shall act as resistance and price will feel difficulties to break above the channel and ribbon. With some slightly complicated calculation on the higher high and lower low from multiple timeframes of the same security, “Trexper” generates potential long and short trade signals.
It came along with small lines drawn on high or low of a price bar which pinpoints the highest high or lowest low of the price for that certain financial instrument. Actually, our indicator is also using another powerful indicator to generate signals: Average true range (ATR) and True range (TR). The most contribution goes to the average true range and true range for our indicator to decide either a long or short signal.
WHAT’S THE BENEFIT OF USING TREXPER?
– Powerful 5 concepts used in one. Donchian channel, moving average ribbon, average true range,true range, swing high and low.
– Clearly shows support and resistance levels, as well as momentum and trend direction.
– Donchian channel and the ribbon indicate the overall market trend with the help of EMA and SMA.
– Dynamic resistance and support levels.
– Generate potential long and short trade signals.
– Traders can determine the strength of a trend by looking at the distance between the moving averages ribbons.
– ATR calculation method can be changed from normal ATR to SMA version true range inside setting byclicking and unclicking the input function named “Change ATR Calculation Method?”.
– Long and short signals can be turned off/on using “Show Buy/Sell Signals”.
– Alert feature is available for long and short signals.
Product Features
- Powerful 3 indicators concept used in one.
- Long/Short signals.
- Overall market trend.
- Dynamic resistance and support levels.
- Determines the strength of a trend.
- Alert feature.
- All currency pairs.
Related products
-
‘Milking The Markets’ With Renko Bar Trading
$59.00 -
‘Pop Out Of The Box’ Pattern by Doug Campbell
$49.00 -
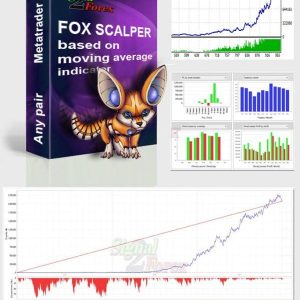
“FOX SCALPER” – FOREX EXPERT ADVISOR BASED ON MOVING AVERAGE INDICATORS.
$110.00 -
“Kaizen ON-DEMAND Apprenticeship” by Steve Nison
Original price was: $895.00.$200.00Current price is: $200.00. -
Velocity Expert Advisor
Original price was: $300.00.$40.00Current price is: $40.00.


