Your cart is currently empty!
Sale!

Forex Arcanum 2014
Original price was: $99.00.$10.00Current price is: $10.00.
www.fxarcanum.com/offer/Original Price $99Indicators:1.FXArcanum_entry.ex42.FXArcanum_dynamic_levelsH1.ex43.FXArcanum_dynamic_levelsM1.ex44.FXArcanum_dynamic_levelsM5M15.ex4Templates:1.FXAMdaytrading.tpl2.FXAMscalp.tpl3.FXAMswingtrading.tplEbook:Forex Arcanum – System Manual FREE VIDEOS: Day Trading Examples: http://www.fxarcanum.com/wp-content/uploads/2014/12/clip1Nwma.mp4?_=1 How Does it Work?: http://www.fxarcanum.com/wp-content/uploads/2014/12/clip2WMA.mp4?_=2 The system is comprised of two parts.The first one is investors’ levels of interest. The levels are represented by horizontal lines on the chart. Thick line shows us long-term interest. Thin line shows us short-term interest. Thick line (1) shows us a long-term interest. Investors were interested in activity […]
Description
www.fxarcanum.com/offer/
Original Price $99
Indicators:
1.FXArcanum_entry.ex4
2.FXArcanum_dynamic_levelsH1.ex4
3.FXArcanum_dynamic_levelsM1.ex4
4.FXArcanum_dynamic_levelsM5M15.ex4
Templates:
1.FXAMdaytrading.tpl
2.FXAMscalp.tpl
3.FXAMswingtrading.tpl
Ebook:Forex Arcanum – System Manual
FREE VIDEOS:
- Day Trading Examples: http://www.fxarcanum.com/wp-content/uploads/2014/12/clip1Nwma.mp4?_=1
- How Does it Work?: http://www.fxarcanum.com/wp-content/uploads/2014/12/clip2WMA.mp4?_=2
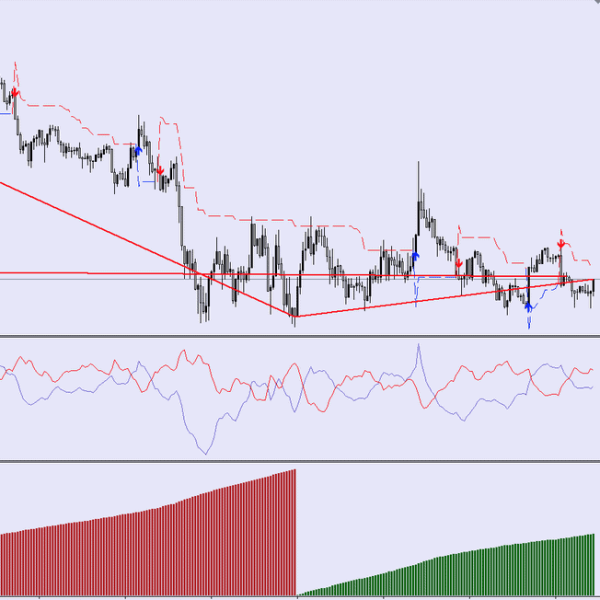
The system is comprised of two parts.
The first one is investors’ levels of interest. The levels are represented by horizontal lines on the chart. Thick line shows us long-term interest. Thin line shows us short-term interest.
Thick line (1) shows us a long-term interest. Investors were interested in activity around that line throughout the past several days/hours (depending on the Time-Frame we chose).
Thin line (2) shows us a short-term (current) interest. Investors have been making transactions around that zone throughout the past several minutes or hours (depending on the Time-Frame we chose).
How to use it practically?
It is very simple. The lines’ arrangement tells us about the currently dominating sentiment on a given pair. Thin line under thick line – bear market – we sell.
The second part of the system is an algorithm that analyzes prior behavior of the price and on its basis calculates probable places for further movement.
StopLoss order should be placed at the last swing high (for sell trades) or at the nearest resistance level (if closer).
Where to put a Take-Profit order :
Firstly, take note of the trade momentum. Does the price move dynamically or does it remain in one place for a long time? Based on that, you can determine your expectations as a simple R:R balance.
An open order that generates profit can be secured by a Break-Even order. For example, if your trade generates profit of 1R and the price moves very dynamically, you can use a BE order which will secure this transaction in case the price suffers a reversal.
Also remember that BreakEven can sometimes deprive you of potential profit, as it sometimes happens that a price take a significant turn and then gets back to its trend.
Related products
-
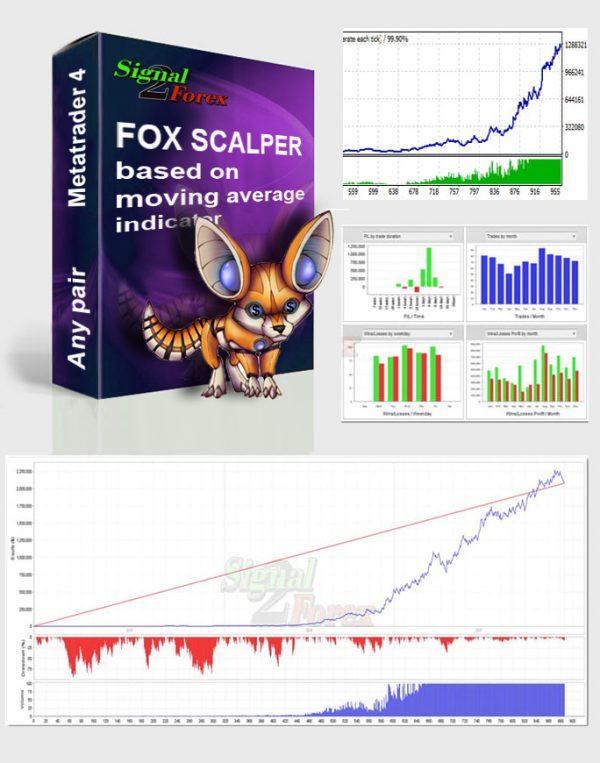
“FOX SCALPER” – FOREX EXPERT ADVISOR BASED ON MOVING AVERAGE INDICATORS.
$110.00 -
‘Milking The Markets’ With Renko Bar Trading
$59.00 -
ZOREX SYSTEM
$14.00 -

ZEUS GOLD EA
$15.00 -
Zee Trend Following System
Original price was: $137.00.$69.00Current price is: $69.00.